
Why Some Capex Delivers 10x Returns — While Others Just Drain Cash
Issue #9 explores the different faces of capex, a framework to compare one capex against another and some accounting shenanigans

Capital expenditures serve as leading indicators and inflection points for future revenue, margins, and competitive advantage of businesses. Unlike operational expenses, which sustain a business, capex have the ability to transform it.
However, all capex are not built equal and some are way better than others. While some create, others destroy value at scale.
Investors often underestimate game-changing capex and overestimate ‘safe’ maintenance spending. This article intends to serve as a guide to help investors to not only differentiate the types of capex but compare the superiority of one capex to another.
In this article, we break down:
1️⃣ The Many faces of Capex
2️⃣ How to Compare One Capex to Another
3️⃣ How Capex is Manipulated in Accounting
We look at multiple, real life examples stating excerpts from concalls, SEBI filings, reports etc. which builds a lens for spotting non-linear, ‘capex optionality’ in the equities markets. In the end, we also touch upon some accounting treatments which typically tend to undereport/disguise capex spends for something else.
With the context set, here’s the applied playbook 📗for decoding Capex:

The Two Faces of Capex:
Broadly, there are two types of capex: Maintenance Capex and Growth Capex.
A. Maintenance Capex 🛠️ (Keeping the Lights On)
Maintenance Capex refers to capital expenditures required to maintain a company's current operations, assets, and competitive position—without expanding the business. It includes the essential spending required to sustain current operations (e.g., routine servicing of old machinery, upgrading old equipment, renovating stores to keep them functional).
Every year, companies report capital expenditures in thier statement of cash flows. The idea is that each year a part of this outlay supports the business at its previous year’s level of sales, and the other part contributes to the increase in sales it has achieved.
For example, depreciation ≈ Maintenance capex (in stable businesses)
So how do we calculate maintenance capex:
We calculate the ratio of Property, Plant & Equipment (PPE) to Sales for each of the five prior years and find the average.
This indicates the amount of PPE it takes to support each INR of sales.
We then multiply this ratio by the growth (or decrease) in sales dollars the company has achieved in the current year. The result of that calculation is growth capex.
We then subtract it from total capex to arrive at maintenance capex.
Read the bullet points again, slowly. If you’re still confused, let’s apply this method to calculate the maintenance capex for a made-up company ABC for the year 2025:

Step -1: The ratio of PP&E to Sales shows that in 2019, the company needed ₹20 in PPE for generating ₹100 in sales. This means it needs ₹0.20 in PPE for generating ₹1 in sales (₹20 / ₹100). In the same vein, the average PPE-to-Sales from 2019 to 2024 comes to ₹0.25. Instead of taking the last year’s ratio we take the average. Why? Because the average smoothens peaks-and-troughs enabling our calculations to be less prone to distortions caused by business cycles.
Step -2: In 2025 the company increased its sales by ₹20 ₹(160 – 150) and its total capital expenditure increased by ₹10 ₹(50 – 42). In Step 1 we calculated that for generating ₹1 of sales the company on average needs ₹0.25 in PPE. For generating ₹20 of additional sales the company needs ₹5 (₹20 * 0.25) in PPE which is the growth capex.
Step -3: Subtracting growth capex of ₹5 from total capex of ₹10 we get the maintainence capex of ₹5.
B. Growth Capex 🏗️ (Fuels Revenue/ Margin expansion)
We have already seen how to calculate growth capex. However, this type capex comes in various shapes and form. Having a mental map of these help investors identify management’s real priorities (i.e. growth vs. survival)
1. Greenfield vs. Brownfield Capex

Example of Greenfield Capex:
Paramount Communications setting up a greenfield facility to produce DC and AC cables in MP.


Similarly, greenfield expansion is also being planned in Shakti Pumps (India) Ltd. to install a new pump for DCR cells.


Whereas a good example of Brownfield expansion is that of SAMHI Hotels where the company repurposed an office building in Hitec City, Hyderabad to a premium hotel.

2. Forward & Backward Integration

Examples of Forward Integration:
a) Mangalam Organics, one of the largest manufacturers of Camphor and Synthetic Resins, expanding into its own retail brands of camphor-based homecare products, Mangalam and CamPure.

b) Another is the recent entry of the Adani group into the wires and cables business:

Examples of Backward Integration:
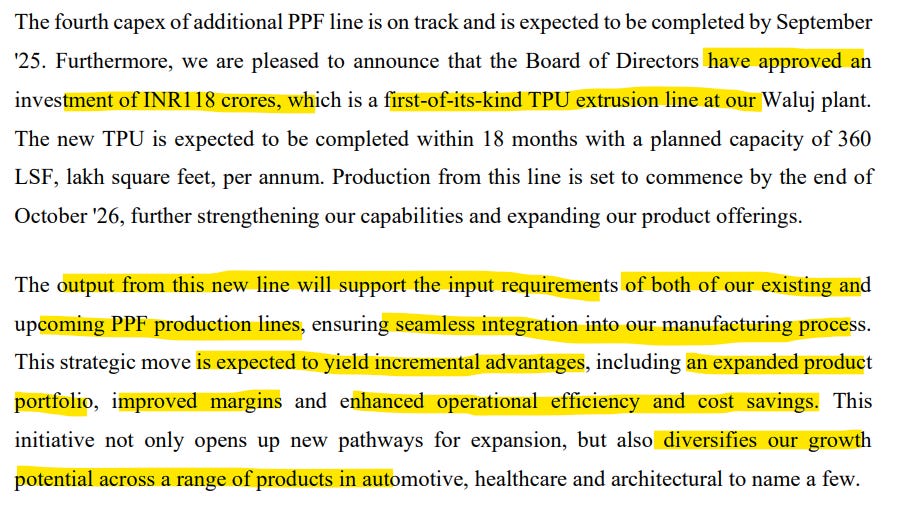
a) A fitting example of backward integration is of Garware Hi-Tech’s capex into the TPU Extrusion plant. We wrote an investment thesis on the company here.

b) Another example of backward integration is of Saregama Ltd. which is one of the oldest music label companies in the country. One of its primary businesses is licensing its IP library of 150k+ songs across 23+ languages. The company routinely procures music from film producers, studios and independent artists to augment their existing library. As such, backward integration in this business would be to produce in-house talent/ budding artist management which can organically add to its existing library. And that’s exactly what they’re doing with Saregama Talent.

3. Lateral Expansion
Lateral expansion refers to a growth strategy where a company broadens its operations at the same stage of the value chain. Unlike vertical integration (forward/ backward), lateral expansion focuses on widening the reach rather than expanding into upstream/downstream processes. These companies typically:
Enter into new markets (geographic expansion)
Diversifying into related products and services
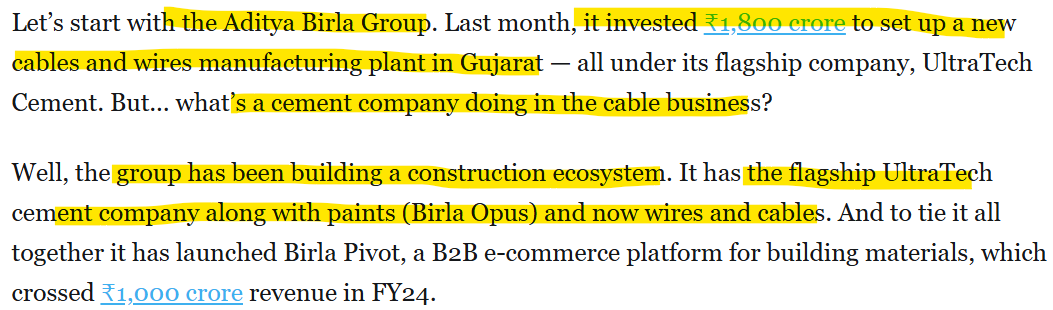
Example: a) The Aditya Birla group creating an ecosystem of Paints, Cements & Building materials.
b) Zaggle Prepaid Services transitioning from products to platforms business to provide all-round solutions around the expense side of the P&L. Find our full investment thesis of the company here.

c) Another example is PB Fintech’s (Policy Bazaar) foray to set up offline service offices to handhold customers in their last mile journey of buying an insurance.
4. Debottlenecking
Debottlenecking essentially means incorporating small tweaks to unlock big capacities. It involves optimizing existing infrastructure to increase production throughput, reduce time or improve efficiency. It’s a cost-effective way to improve output and maximize ROI on existing assets. Examples include a chemical plant tweaking a reactor configuration to speed up reactions or a car factory installing robotic arms in its assembly lines.
A recent example is of Shakti Pumps (page 4, Q2 FY25 concall):
The company had a capacity to make 2500 crores worth of revenue and as such it was a bottleneck for revenue growth. When asked about this the management stated that it is adding some machinery in the next 3 months which can increase its existing capacity to 3000-3200 crores worth of revenue.

5. R&D and Intangibles
R&D involves capex to develop new products/ tech such as drug trials, fast charging EV batteries, AI model training etc. Whereas intangibles include investing in brand development, filing new patents, copyrights, acquiring datasets etc.
These are the high-risk-high-reward types of capex which can lead to entirely new revenue streams and create strong durable moats which may lead to exponential growth. On the flipside they may take several years to develop and run the risk of being edged by competitors in terms of first mover advantages/ patent approvals.
R&D is very common among pharmaceutical companies specifically engaged in the CRAMs segment. An apt example is:
a) Dr. Reddy’s annual R&D expenditure (Annual report FY24, page 107)

b) Axis Bank’s acquisition of Citi Bank’s consumer business for ₹11,603 crore. This added 1.8 million credit card holders and ₹94,700 crore worth assets under management (AUM) to Axis Bank’s portfolio.
c) Finally, Jubilant Foodworks Limited holding the exclusive master franchise rights to operate Domino’s Pizza in India, Sri Lanka, Bangladesh, Turkey, Nepal, Azerbaijan, and Georgia is a good example of intangible assets.
Comparing Capex and Measuring Success
There are several ways to evaluate whether one capex project can outperform another by using a mix of metrics (ROI, NPV, IRR etc.) and KPIs (equipment effectiveness, unit cost reduction, downtime reduction etc.). However, unless the investor is the close to/CFO of the company, she won’t have the granular details to come to a reasonable estimation of these metrices.
Hence, for practical purposes we focus on three metrics for measuring the superiority of one capex to another:
1. Incremental Revenue per Unit of Capex
2. Efficiency measured by Margin Expansion (if any)
3. Payback Period – The Amount of time it takes to recover the Capex
Incremental Revenue per unit of Capex (IRUC)
This is just an extension of the NFAT ratio. Instead of computing Net Sales / Net Assets, we compute [Incremental Revenue post Capex] divided by the [Capex amount] itself. This measures how efficiently a company generates revenue from its fixed asset investments.
Say a company intends to expend 60 crores to set up a plant which is expected to generate revenues of 90 crores per year at full capacity. In this case, its IRUC would be 90/60 = 1.5x. This means every unit of capex leads to 1.5 units of sales. Typically, the higher this ratio, the better. A prudent business would only do capex where the IRUC would be greater than some thresholds say 1.5x or 2x.
All that said, it’s important to benchmark this ratio with the company’s own historical trends and comparable competitors who might have executed similar projects in the past. Also note that this ratio varies between industries. For example, an IRUC of 2x is great in the auto industry but perhaps commonplace in the tech business.
We take the example of the export-oriented, garment manufacturing company Gokaldas’s acquisition of Matrix to study the same.

Gokaldas paid INR 489 crores to acquire 100% stake in Matrix against a sale of 596 crores. Since the entire sales in this case is incremental the implied IRUC is 596/489 ≈ 1.2x. While this looks just okay on paper, informed investors would also factor in potential future revenue growth from expanded geographical footprints and new manufacturing methods. In which case, the IRUC would be >1.2x.
Another instance is where the capex outcome maybe higher than what is reflected in the numbers. This is perhaps true for the acquisition of Atraco. In the recent context, Atraco enables geographical diversion which helps in mitigating the impact of higher tariffs from importing countries. US has not imposed any tariff on African nations such as Kenya and Ethiopia (where Atraco is located) which may lead to relatively higher realizations.
Margin Expansion
Sometimes efficiency can’t be measured by revenues alone. Especially in case of backward integration where intermediate products are produced in-house for price and supply stability.
Improvement in gross, operating or net profit margins are powerful indicators of successful capital expenditures. When executed strategically capex can drive efficiencies reduce costs, or enable premium pricing, all of which boosts margins.
A pertinent example is Garware Hi-Tech Films, which undertook transformative capex initiatives since 2018 that significantly changed its revenue mix from a commodity business to a high margin value added business.

Payback Period
Revenue and margins are part of the story and not the whole. The payback period gives a critical insight to the trident for comparing and measuring capex. The payback period is essentially the time required for a capex to generate sufficient cash flows to fully recover the initial investment. Thus,
Payback Period = Initial Capex Outlay/ Annual Net Cash Inflows
For uneven cash flows we cumulate the calculation until the full investment is recovered.
An example of Payback period is of TIPs Music Ltd, where the company does capex to add music to their library of songs similar to Saregama India Ltd. They do it via developing new content, recreating old content, plus acquiring from producers like Balaji and Northern Lights. In their Q1 FY25 concall, they mentioned that they look at a period of 3-5 years to recover their entire cost.

Common Accounting Shenanigans
Companies often use accounting loopholes to understate capital expenditures and artificially boost profits. These tricks make earnings look better than they truly are, masking the real cash needed to sustain the business. In this section, we explore some of the common accounting practices including how capex is accounted for and a few types of accounting jugglery used to conceal capex.
Do note that we will tread lightly on these topics only for the sake of exposure. Each of these topics deserves a standalone article themselves. However, an investor would be at an advantage by being aware of these accounting treatments before they assess capex.
Accounting may not be at the top of an investor’s wish list in finance; however, it’s probably the most important tool in their arsenal. We especially emphasize you going through this section carefully as you might disproportionately benefit from them later.
Here’s a mini course on Capex Accounting:
Interest Capitalization
The Basics: companies capitalize their interest cost to fixed assets. Say a company borrows ₹1,000 crores to set up machinery for which it needs to pay ₹200 crores of interest over the tenor of the loan. The value of the fixed asset would then be recorded as ₹1,200 crores on the balance sheet.
Why is this so?
The logic is that even though the costs are incurred in a given year, the machinery runs a longer life and keeps on producing goods for many years. As such, the total cost of the plant including the interest on the debt is not recognized as an expense in the P&L in the year in which it is incurred. Instead, it’s recognized as a cost in the P&L as depreciation over the life of the asset.
For any given year the P&L should reflect revenues and costs related only to the items which are sold in that particular year. If a company expenses all the cost of the machinery in a given year it would distort the revenue recognition principle where costs relating to goods produced in future years is expensed in the current year.
A few nuances to keep in mind:
1. The interest expense in the P&L is not equal to the total interest outflow of the company. It is the net of capitalized interest. An investor can get the amount of total interest paid by the company in the cash flow from the financing section of the cash flow statement. Also, many companies show capitalized interest as a part of an increase in fixed assets under cash flow from investing activity.
2. In some cases, the interest cost on debt for fixed assets is added to CWIP and not deducted from sales while calculating net profits. This artificially inflates the profits and thus one should check the cash flow statement to find the total interest outgo.
Capex Financed on Lease
Pre-2019, leases used to be a classic tool for keeping debts off balance sheet. Under old rules (pre-2019) operating lease such as renting equipment was only treated as an expense in the P&L without any record on the liability or asset side of the balance sheet. As such, say an airline company could have 100 crores of lease payments from leasing aircraft, which is effectively debt. But the same would not have appeared in their debt-equity and interest coverage ratios owing to their off-balance sheet treatments.
Post 2019, under IFRS 16’s rule, all leases must be capitalized in the balance sheet and should be recorded as a ‘Right-of-Use’ (ROU) Asset and ‘Lease Liability’. Whereas, rent expenses in the P&L are replaced with depreciation (ROU) and interest (lease liability). As such, repayments are split into a principal and interest portion which provides a better visibility.
While a deep dive into the computation is beyond the scope of this article, here is a link which provides an excellent explanation with a practical example. We urge you to work it out on a spreadsheet for better understanding.
Capital Work-in Progress (CWIP)
CWIP is an accounting line item where companies record ongoing capex (unfinished factories, uninstalled machinery) before they are operational. While legitimate, CWIP can be abused to delay expense recognition, inflate profits and obscure the actual financial state of a company. Some common methods are:
a) Delaying Depreciation to boost short term profits: By keeping projects in CWIP for extended periods, companies avoid depreciation hits.
b) As CWIP is often less scrutinized than PP&E, its values have a higher inclination to be inflated.
c) Projects indefinitely lying in CWIP also indicate cost-overrun and extended timelines
Excellent article